Automate Budget Tracking with Google Sheets and Supermetrics
Published on:2020-08-03
byJeff Cooper, Founder & Owner, Saltbox Solutions @ Saltbox Solutions
How many hours have we all wasted just trying to figure out how we are pacing our spend in Google Ads? I’ve probably spent several working days of my career just pulling reports and spreadsheets, all so I can simply adjust the daily budgets of my active campaigns!
Years ago, I went on a journey to get that time back. After hacking some spreadsheets and playing with some plugins, I was finally able to free myself from the pedantic task of data aggregation for budget adjustments.
The solution I found ended up being relatively simple, so I wanted to provide a quick tutorial for those of you that are looking to do something similar.
Supermetrics – A Data Puller For Google Sheets

If you’ve never heard of Supermetrics, check out our article on Getting Started with Supermetrics and Google Sheets for a brief primer on what it is, how to install it as a Chrome add-on, and some simple examples of how to use it.
This tool will let us set up an automated way to get Google Ads data into Google Sheets. Although scheduling these data pulls requires a paid license, you can still create a tool that lets you get all this data by simply manually refreshing a query.
Setting Up A Custom Query To Get Your Budget Information
How we configure a custom query to get our data from Google Ads depends on whether we want to do this exercise for an account, multiple accounts, or at the campaign-level.
For the sake of example, we will keep it simple and just assume that we have one account for which we want to pace our spending across both Search and Display.
To get started, we will want to set up a new Google Sheet and create a Supermetrics query.
From the sidebar menu, we want to create a new query and select the following options:
Data source
Authenticate with a user that can access your Google Ads account
Select Google Ads as the data source (of course!)
Account
Select the account you want to analyze
For this example, we’ll pick one – but you could pull data from multiple accounts at once
Dates
Most of our clients have monthly budgets – so we will choose “this month to yesterday” as the date range we are interested in
If you manage your budget differently, you might try “last 30 days” or “this year to yesterday” depending on your goals
Metrics
Since we are doing budgeting, we only care about “cost” right now
Theoretically, you could pull any data found through the UI and really beef up your automated reporting
Split by
Here we decide how to segment our data into rows and columns
For this example, we will simply split the ‘cost’ metric into different rows for the different ‘networks’
Filter
We don’t need to add a filter for this example
If you wanted to, you could only look at active campaigns – or filter by certain ad group names
Options
For now, we will leave these as the default values
As you get more comfortable Supermetrics, you may want to play around with these options
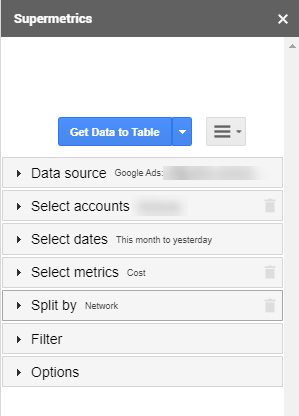
Once we run this, we will see our data pulled right into our Google Sheet – ready to be manipulated by our formulas:
Simple Formulas For Projecting Budgets
So what’s next? There are a ton of different ways to calculate projected spend, but let’s start simple!
We will assume we will spend evenly every day of the month
We will assume that we haven’t made any major budget changes that would impact the pacing of spend
We will assume that we have our budget broken out by month and network
We are going to take advantage of a few Google Sheets functions that you need to be familiar with:
=NOW() – this function takes no input and returns a timestamp for …right now!
=DATE(year,month,day) – this function takes a year, month, and day input and returns a date
=YEAR(date), =MONTH(date), =DAY(date) – these functions take a date as an input and return the year, month, or day of the month respectively
For the sake of our ‘simple’ budget model, we will use the number of days into a month relative to the total number of days in the month to project our spending. For example, if our report goes through day 15 of a 30-day month, we will project that our spend will be 2x our current actual cost.
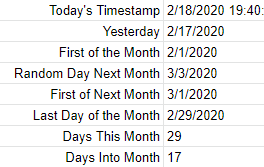
One of the most challenging parts about working with budgeting is actually calculating simple things like “how many days are in this month?” automatically. Let’s walk through a way we can calculate this.
Use “now” function to automatically give us a starting point
=now()
Calculate yesterday’s date by using our “date” function in combination with the “now” result from step 1 (for sake of example, assume the result of “now” is in cell F2)
=date(year(F2),month(F2),day(F2)-1)
This formula takes the year, month, and day of the current timestamp and just returns a date with ‘day’ minus one
Calculate the first day of the month using our ‘date’ function in combination with yesterday’s date (assume ‘yesterday’ is in cell F3)
=date(year(F3),month(F3),1)
Similar to the calculation of yesterday, this hard-references day “1” of the month
We now need to calculate the end of the month. The challenge is that different months have different lengths (don’t get us started on leap years) and we need an algorithmic way to address that. Here’s a little trick we’ve picked up to help us do just that:
We first calculate a random day in the future that we want to guarantee falls in the next month
We do this by adding 31 (the minimum # of days to guarantee this works!) to our former calculation of the first day of the month
=F4+31
We are simply adding 31 to the date we calculated in the last step
We now calculate the first day of the month relative to this new date (essentially calculating the ‘first day of next month’)
=date(year(F5),month(F5),1)
This formula works exactly like our calculation for the current month
We can now simply subtract 1 from that new date (representing the first day of next month) to calculate the last day of the current month
=F6-1
This gives us a repeatable way to calculate the last day of the month regardless of which month of the year we are in (even works for leap years!)
Once we have this, it becomes very easy to calculate the “days in the month” or the “current days into the month” that our report covers.
Now our calculation is simple, we can just add a column to our report that uses “days this month” and “days into month” to calculate our projected ad spend:
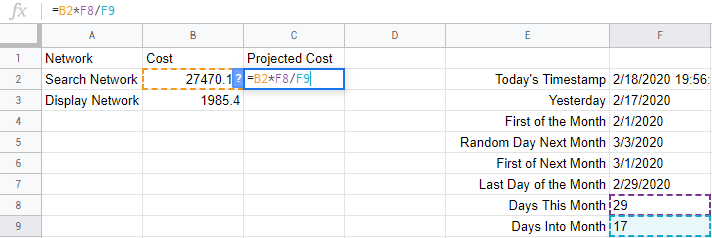
…whether we schedule this query or simply refresh it manually, we now have a simple automated budget tracker!
Taking It To The Next Level
Ok. We get it – our example is simple. What if we made recent changes to the budget pacing? What if we spend differently based on the day of the week? What if we set our budgets at the campaign level? What if we need to monitor spend across multiple Google Ads accounts?
We promise it can all be done via Google Sheets and Supermetrics. We suggest you at least start by hacking away at your own custom budget tracker. Even a simple solution can save you a ton of time. Your future self will thank you!


Jeff Cooper
Founder & Owner, Saltbox Solutions, Saltbox Solutions
Jeff Cooper founded Saltbox Solutions to help B2B software, cybersecurity, and professional services companies attract and convert more customers online. Combining expertise in marketing strategy, software development, and analytics; Jeff has spent over 15 years building scalable, results-driven programs that deliver measurable growth. Earlier in his career, he led digital acquisition initiatives for major consumer product, technology, and insurance brands including Bass Pro Shops, RackSpace, La-Z-Boy, and HealthMarkets.
Today, Jeff serves as an advisor and owner of Saltbox Solutions, guiding strategy and innovation while exploring new ways to apply AI and automation to client campaigns. His focus remains on helping businesses achieve predictable, sustainable growth through data-driven decision-making and cutting-edge technology.